Yahoo! Finance
Friday, June 10, 2011
Many programmers work for publicly traded companies, and probably spend more time than they realize watching their (or their friends) company’s stock prices. To make that easier, I wanted to implement a simple wrapper to retrieve prices from Yahoo! Finance.
Quotes
You can use a “quotes.csv” interface to retrieve current price information. The way it works is to perform an HTTP request to a specially formatted URL that looks like:
https://finance.yahoo.com/d/quotes.csv?s=SYMBOLS&f=FIELDS
In the URL, SYMBOLS is a list of symbols separated by “+” and
FIELDS is a list of letters and numbers (from the following table)
representing fields to be requested.
| a | Ask | a2 | Average Daily Volume | a5 | Ask Size |
| b | Bid | b2 | Ask (Real-time) | b3 | Bid (Real-time) |
| b4 | Book Value | b6 | Bid Size | c | Change & Percent Change |
| c1 | Change | c3 | Commission | c6 | Change (Real-time) |
| c8 | After Hours Change (Real-time) | d | Dividend/Share | d1 | Last Trade Date |
| d2 | Trade Date | e | Earnings/Share | e1 | Error Indication (returned for symbol changed / invalid) |
| e7 | EPS Estimate Current Year | e8 | EPS Estimate Next Year | e9 | EPS Estimate Next Quarter |
| f6 | Float Shares | g | Day’s Low | h | Day’s High |
| j | 52-week Low | k | 52-week High | g1 | Holdings Gain Percent |
| g3 | Annualized Gain | g4 | Holdings Gain | g5 | Holdings Gain Percent (Real-time) |
| g6 | Holdings Gain (Real-time) | i | More Info | i5 | Order Book (Real-time) |
| j1 | Market Capitalization | j3 | Market Cap (Real-time) | j4 | EBITDA |
| j5 | Change From 52-week Low | j6 | Percent Change From 52-week Low | k1 | Last Trade (Real-time) With Time |
| k2 | Change Percent (Real-time) | k3 | Last Trade Size | k4 | Change From 52-week High |
| k5 | Percent Change From 52-week High | l | Last Trade (With Time) | l1 | Last Trade (Price Only) |
| l2 | High Limit | l3 | Low Limit | m | Day’s Range |
| m2 | Day’s Range (Real-time) | m3 | 50-day Moving Average | m4 | 200-day Moving Average |
| m5 | Change From 200-day Moving Average | m6 | Percent Change From 200-day Moving Average | m7 | Change From 50-day Moving Average |
| m8 | Percent Change From 50-day Moving Average | n | Name | n4 | Notes |
| o | Open | p | Previous Close | p1 | Price Paid |
| p2 | Change in Percent | p5 | Price/Sales | p6 | Price/Book |
| q | Ex-Dividend Date | r | P/E Ratio | r1 | Dividend Pay Date |
| r2 | P/E Ratio (Real-time) | r5 | PEG Ratio | r6 | Price/EPS Estimate Current Year |
| r7 | Price/EPS Estimate Next Year | s | Symbol | s1 | Shares Owned |
| s7 | Short Ratio | t1 | Last Trade Time | t6 | Trade Links |
| t7 | Ticker Trend | t8 | 1 yr Target Price | v | Volume |
| v1 | Holdings Value | v7 | Holdings Value (Real-time) | w | 52-week Range |
| w1 | Day’s Value Change | w4 | Day’s Value Change (Real-time) | x | Stock Exchange |
| y | Dividend Yield |
Using this URL format, we can build a word that retrieves current quotes for a list of symbols:
: quotes ( symbols -- csv )
    "https://finance.yahoo.com/d/quotes.csv" >url
        swap "+" join "s" set-query-param
        "sbal1v" "f" set-query-param
    http-get nip >string string>csv
    { "Symbol" "Bid" "Ask" "Last" "Volume" } prefix ;
With the strings.table vocabulary, we can format the response as a table:
IN: scratchpad { "MSFT" "GOOG" "AAPL" } quotes
               format-table [ print ] each
Symbol Bid    Ask    Last    Volume
MSFT   23.64  23.69  23.705  49327104
GOOG   505.00 509.05 509.505 2440475
AAPL   N/A    334.80 325.90  15504200
Historical Prices
You can also retrieve historical prices using a “table.csv” interface. Similar to retrieving quotes, you make an HTTP request to a special URL:
https://ichart.finance.yahoo.com/table.csv?s=SYMBOL
In the URL, SYMBOL is the symbol that you are requesting prices for,
and you can further limit the response using additional parameters:
Start date for historical prices:
- a - Month number, starting with 0 for January.
- b - Day number, eg, 1 for the first of the month.
- c - Year.
End date for historical prices (default is the most current available closing price):
- d - Month number, starting with 0 for January.
- e - Day number, eg, 1 for the first of the month.
- f - Year.
And finally, the frequency of historical prices:
- g - Possible values are ’d’ for daily (the default), ‘w’ for weekly, and ’m’ for monthly.
With this knowledge, we can build a word to retrieve historical prices from January 1, 2009 until the current day.
: historical-prices ( symbol -- csv )
    "https://ichart.finance.yahoo.com/table.csv" >url
       swap "s" set-query-param
       "0" "a" set-query-param
       "1" "b" set-query-param
       "2009" "c" set-query-param
    http-get nip string>csv ;
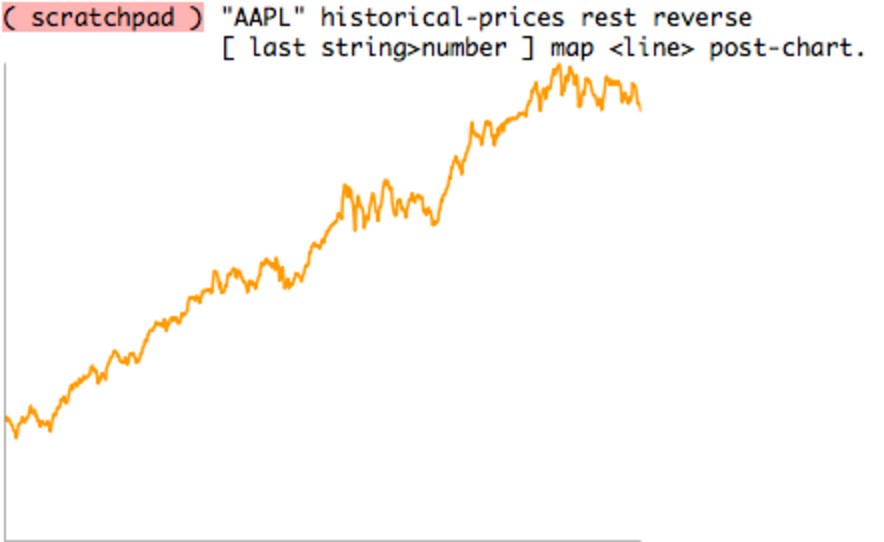
To use it, and demonstrate the impact that AAPL has had over the last few years, we can chart the daily closing prices (remembering to reverse the order of the prices, oldest to newest):

The code for this is on my GitHub.