Google Charts
Friday, March 11, 2011
Recently, I implemented a wrapper for the Google Chart API in Factor. The Visual REPL provides a really great way to do exploratory programming, such as my previous example of integrating Wolfram|Alpha with Factor.
Below are some various examples of using my google.charts vocabulary:
Pie Charts
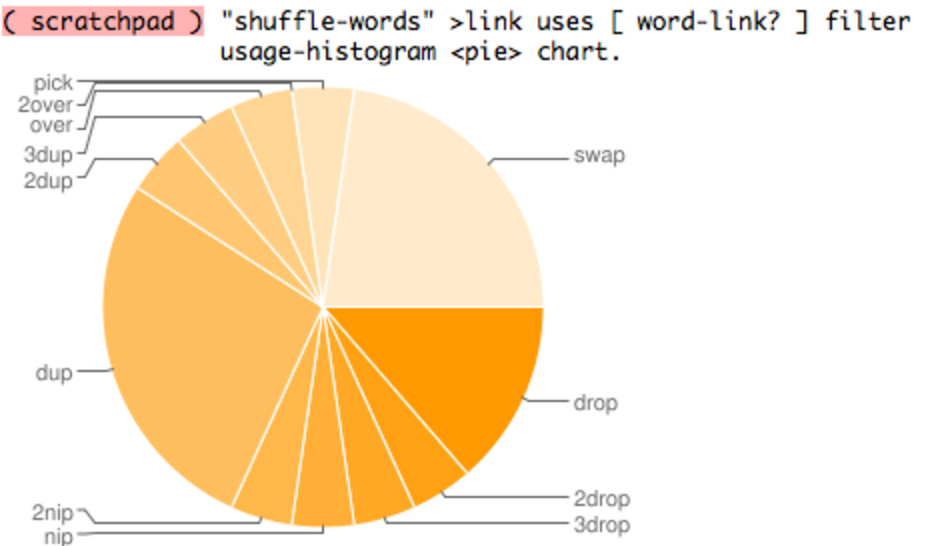
At the end of 2008, Slava Pestov posted an
article
analyzing the usage of shuffle words in the core library. He created a
usage-histogram word that counts the number of usages of a sequence of
words:
: usage-histogram ( words -- assoc )
    [ [ name>> ] [ usage length ] bi ] { } map>assoc ;
We can then produce a pie chart showing the relative usage of various shuffle words:
Bar Charts
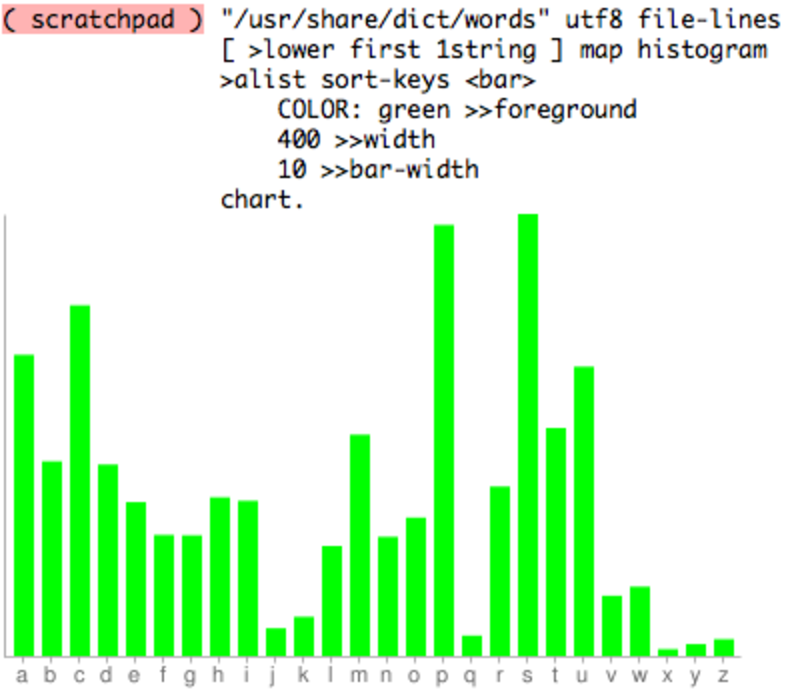
It might be fun to use a dictionary to count the number of words that start with each letter. We can use the dictionary available on most Unix-like systems to make a histogram and display the results as a bar chart:
Sparklines
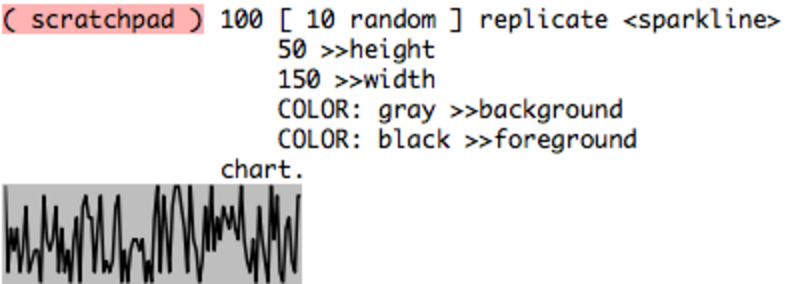
Edward Tufte coined the term sparkline and described them as “data-intense, design-simple, word-sized graphics”. They are often useful for quick visualizations of large data sets, for example a random sequence of numbers:
QR Codes
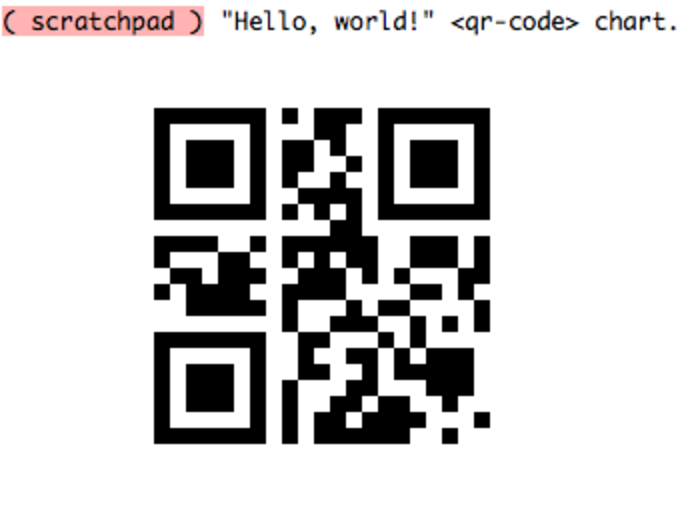
Recently, Fred Alger posted some source code which uses QR Codes and the MECARD format to share address book information with mobile users. We can convert arbitrary text into a QR Code for display:
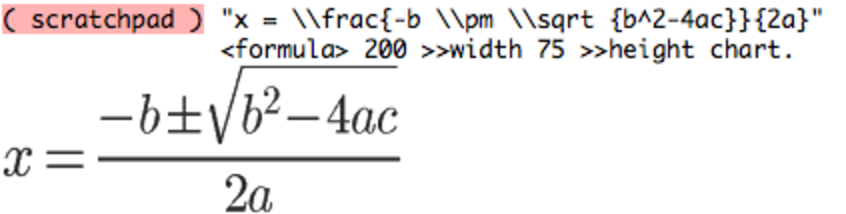
Formulas
We can use Tex to plot formulas:
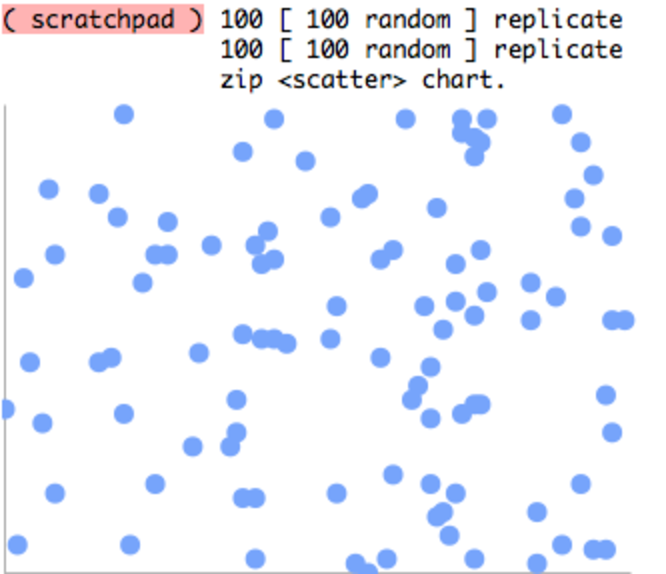
Scatter
We can make scatter plots, for example 100 random x,y points:
The code is available on my GitHub.